

Annual investment requirements in Net Zero scenarios: a step change in scale
One of the most relevant – and least discussed – aspects of Net Zero scenarios does not concern the final outcome in 2050, but the annual level of investment that the energy system would need to sustain along the transition pathway. Rather than describing a gradual and marginal increase in capital, these scenarios imply a structural change in scale compared with historical levels.
Across the main families of Net Zero scenarios, global energy investment is assumed to grow rapidly relative to the average observed over the past decade and to remain at elevated levels for a prolonged period. From an economic and financial perspective, the most informative benchmark is therefore not global GDP or cumulative investment to 2050, but the required annual investment pace and the historically observed capacity of the system to sustain it over time.
Figure 1: Annual clean energy investment in Net Zero scenarios – Source: IEA, Net Zero by 2050 – A Roadmap for the Global Energy Sector, page 22. © IEA 2021. All rights reserved
Box 1 — Annual clean energy investment levels in Net Zero scenarios
- Global investment, 2016–2020: USD 1.2–1.3 trillion per year
- Annual investment in the Net Zero scenario by 2030: USD 4.2–4.4 trillion per year
- Annual investment in the Net Zero scenario by 2050: USD 4.0–4.2 trillion per year
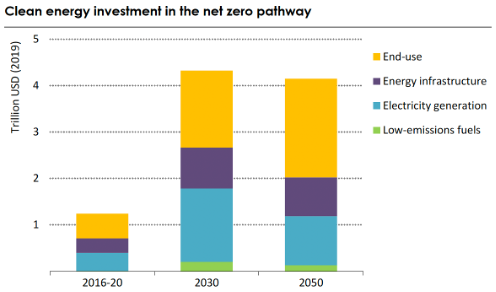
If total energy investment is considered (including fossil fuels), the system has historically mobilised around USD 2.0–2.5 trillion per year. Net Zero scenarios therefore imply not only a reallocation of capital, but a substantial increase in total annual investment.
The key message is quantitative, not normative: the scenarios assume that the global energy system can sustainably double annual investment volumes relative to historical baselines.
Where CAPEX is concentrated: an infrastructure-driven transition
A second key insight emerging from the numbers concerns the composition of CAPEX. Net Zero scenarios do not model the transition as a simple substitution of generation technologies, but as a system-wide infrastructure transformation.
Alongside low-emission power generation, a significant share of capital is allocated to grids, flexibility solutions, storage and end-use interventions. This is a critical point, as it affects not only the volume of investment required, but also its risk profile.
Figure 2: Indicative CAPEX allocation in Net Zero scenarios – Source: IEA, Net Zero by 2050 – A Roadmap for the Global Energy Sector, Figure 4.2, page 155. © IEA 2021. All rights reserved.
BOX 2 — Indicative CAPEX allocation in Net Zero scenarios
- Low-carbon electricity generation: 35–45% in the early phase, declining after 2030
- Grids and system infrastructure: 25–30%, broadly stable
- End-use, electrification and energy efficiency: >40% in the 2030–2050 period
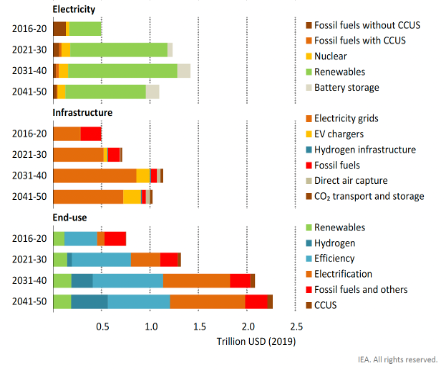
In the central and later phases of the transition, the focus of investment progressively shifts from the supply side to the demand side. Once most low-carbon generation capacity and networks are in place, further emission reductions depend primarily on the transformation of final energy consumption – electrification, energy efficiency and fuel switching – which requires large and widely distributed CAPEX volumes.
While many low-carbon technologies benefit from technological breakthroughs and learning curves that reduce costs and attract competitive capital, a growing share of investment in Net Zero scenarios concerns grids, infrastructure and demand-side transformation. These assets do not experience comparable cost reductions and instead rely on stable regulatory frameworks and predictable remuneration mechanisms. For this reason, the transition requires not only technological capital, but also large volumes of patient and regulated capital.
Carbon pricing: a quantitative pillar, not a secondary assumption
To sustain the required levels of investment, Net Zero scenarios incorporate explicit and rising assumptions on carbon pricing. In the models, carbon pricing does not represent a single policy instrument, nor a point forecast for an emissions trading system, but serves as a synthetic proxy for a broader set of mechanisms – prices, standards, regulatory constraints and incentives – that progressively reduce the competitiveness of high-emission options.
| BOX 3 — Carbon price levels in Net Zero scenarios |
|---|
| – 2030: USD 75–125 per tCO₂ – 2040: USD 150–250 per tCO₂ – 2050: USD 200–400 per tCO₂ across different models |
Source: NGFS Climate Scenarios Phase IV; IEA Net Zero by 2050. Indicative ranges, varying by region and model.
The assumed levels are high relative to carbon prices currently observed in many markets, but they reflect the strength of the economic signal needed to systematically steer investment decisions across the entire energy system. In the absence of an incentive of this magnitude, models show that key components of the Net Zero pathway – particularly those with high upfront costs or long payback periods – tend not to materialise at sufficient scale.
In this sense, the carbon price assumed in scenarios does not quantify a cost to be paid, but indicates how stringent the economic and regulatory framework must be for the system to absorb higher capital requirements, bring forward investment decisions and reallocate resources towards low-emission technologies and solutions. This coordinating role between policy, markets and finance is what makes carbon pricing a structural element of Net Zero scenarios, rather than a secondary detail.
It is also important to note that these assumptions are not disconnected from real-world trends. The progressive reallocation of capital, the strengthening of climate policies and the growing role of international financial institutions in discouraging the financing of new fossil assets suggest that the direction modelled in Net Zero scenarios is already largely embedded in market dynamics.
Investment support mechanisms: why they are structural to the scenarios
Alongside carbon pricing, Net Zero scenarios assume the existence of investment support and stabilisation mechanisms that primarily affect risk profiles and investment timing rather than the overall cost of the transition. Their role is to make projects with high upfront CAPEX, long-term returns and significant exposure to regulatory and market uncertainty bankable at an earlier stage.
In the absence of such mechanisms, even where technologies are mature and carbon pricing signals are rising, a significant share of investment tends to be delayed or scaled down. Capital remains selective, favours lower-risk segments and moves more slowly than required by Net Zero trajectories. In the models, this results in insufficient CAPEX volumes during the early phases of the transition.
Investment support mechanisms therefore operate as mechanisms of anticipation, not cost elimination. By reducing uncertainty – through long-term contracts, guarantees, standards or other forms of revenue stabilisation – they allow the system to absorb investments earlier that would otherwise occur later or at a smaller scale. It is this anticipation, more than the absolute level of support, that ensures consistency with the investment pathways modelled in Net Zero scenarios.
Conclusion
Read through the lens of numbers, Net Zero scenarios tell a clear story. The transition requires unprecedented levels of annual investment, underpinned by strong assumptions on carbon pricing and public support, and consistent with a capital reallocation already visible in policy frameworks and international finance.
This does not make the transition unrealistic or “model-driven”. On the contrary, the scenarios formalise and make internally consistent a direction that the economic and financial system has already embarked upon.
The complexity lies in the transition from system-level coherence to individual decision-making, where managing the absorption of these investment volumes over time and across actors becomes the real critical factor.
In models, the system always invests, in reality, someone has to sign the CAPEX.